
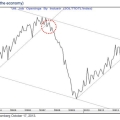
There is reason to be concerned that this stock market decline may begin to dramatically accelerate. There is an incredibly important chart featured below which shows why the stock market may finally be set to crater.
If you look at the chart below, the last time stocks were near this level at the end of August and the beginning of September, there was a tremendous amount of pessimism. If you look at the chart today, after many speculative stocks have soared, there is a great deal of optimism. When stocks were at the recent lows, KWN warned on September 1st that there could be a fierce rally because of the pessimism. The Dow proceeded to see a huge 1,000 point surge. Now it appears the opposite may be true as stocks could be set for a dramatic decline based on the latest reading.
Here is the latest Investors Intelligence report along with the all-important sentiment chart: “… After their third straight increase the bulls were 46.4%, up from 44.3% a week ago. August ended with a reading of 37.1% after a month of contraction from 51.6%. They were mostly invested at those highs. After raising cash with the sell-off they are still recommitting those funds as they project a return to recent highs. Their number can increase more before they point to a nearly fully invested outlook. Readings above 50% start to become a concern. The prior reading near the August low for the bulls was in November 2012 when their count was 37.2%.
Negative projections decreased despite the budget deadlock, with a drop for the bears to 18.6% from 20.6% the prior week. The bearish reading has remained near 20% almost throughout this year, and that was just above the low at 18.1% from early August. They were surprised by the Fed’s recent failure to shift strategy as they believed that was the primary support for stocks this year. A few added the debt problem but overall they are clearly frustrated for the market’s strength. If markets climb a wall of worry the lack of bears is a worry for further gains.

There was barely any change for those projecting a correction. That reading was 35.0%, just down 0.1% from last issue. Late August/early September had two weeks with the correction above the bulls. That last occurred early June 2012, and added to the suggestion of a sentiment trading buy which is still in effect. If stocks do show a larger retreat from highs the correction could exceed the bulls again.
The difference between the bulls and bears approached negative levels with its jump to 27.8%, up from 23.7%. It has more than doubled since late August when the spread was 13.4%. That was close to 10% (or less) where we look to buy but conditions are always changing. The reading is near the difference of 33.1% from early August. Spreads above 30% suggest traders are mostly invested and signal potential danger. Narrow spreads offer buying chances. The bears have not outnumbered the bulls (negative spread) since Oct-2011.”
King World News note: The bottom line here is that the reading above is a very troubling sign for the bulls. It is waiving a red flag that investor sentiment is remaining stubbornly bullish, even though stocks have retreated well off of the recent highs. This could mean the bears will finally get some revenge on the downside in stocks.
To subscribe to Investors Intelligence CLICK HERE.
Related posts:
 Stocks Are Now Set To Experience A Massive 22% Plunge
 Fleckentstein – Gold & What Is Going To Make Stocks Crater
 The Scary Chart That Has Everyone In Washington Terrified
 Stock Market – Fat Lady Has Yet To Sing. Some Questions About YOUR Stocks?
Taking Stock Of Gold Stocks – ANV, NGD, AUY, FCX, NEM, AEX, GDX
Taking Stock Of Silver Stocks – SLW, PAAS, CDE, AG, SSRI, HL
Stock Market – Fat Lady Has Yet To Sing. Some Questions About YOUR Stocks?
Taking Stock Of Gold Stocks – ANV, NGD, AUY, FCX, NEM, AEX, GDX
Taking Stock Of Silver Stocks – SLW, PAAS, CDE, AG, SSRI, HL